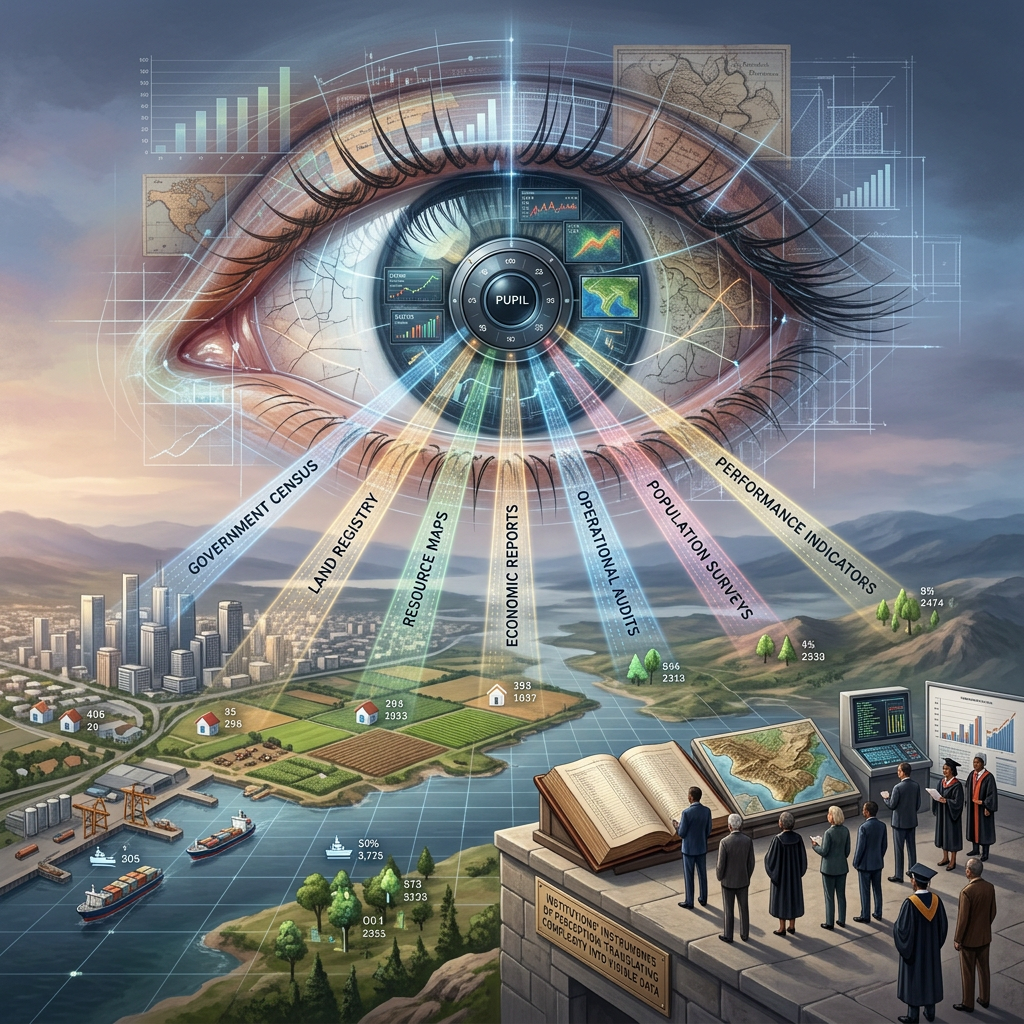
Institutions have always needed ways to see the world they are expected to govern. Governments rely on censuses, registries, maps, reports, and administrative records. Organizations depend on accounting systems, performance indicators, surveys, audits, and operational data. These instruments make large and complex realities visible enough to be interpreted and acted upon. Without them, institutions would be forced to rely on fragmented observation, personal experience, or incomplete narratives.
Digitalization has expanded this capacity dramatically. Institutions can now monitor activities in real time, integrate multiple sources of information, identify patterns across large populations, and visualize complex conditions through dashboards and predictive systems. The result is a new form of institutional vision, one that is broader, faster, and more continuous than previous administrative systems could provide.
Yet greater visibility does not necessarily mean deeper understanding. Data allows institutions to see more, but it also shapes what they are capable of seeing. Every dataset reflects choices about what should be collected, how categories should be defined, which variables should be prioritized, and how reality should be translated into measurable form. Institutional vision is therefore never simply a mirror of the world. It is constructed through the systems that make some things visible and leave others in the background.
The central challenge of a datafied world is not whether institutions can see more. It is whether they can distinguish between what becomes visible through data and what remains outside the field of measurement.
Seeing Through Data
Institutional vision depends on representation. A government cannot directly observe every household, business, school, hospital, or community. An organization cannot monitor every interaction, decision, and informal practice. Instead, institutions rely on representations of reality that allow complexity to be reduced into forms that can be processed.
Data performs this function by transforming experience into records, categories, indicators, and patterns. A population becomes demographic data, economic activity becomes statistics, service delivery becomes performance metrics, and social conditions become measurable variables. This transformation makes large-scale governance possible because institutions can compare places, monitor changes, and identify problems without direct observation.
The value of this capacity is difficult to overstate. Data can reveal inequality that might otherwise remain hidden. It can identify regional disparities, detect emerging risks, and show whether policies are producing intended outcomes. Institutional vision becomes more systematic because it is less dependent on isolated impressions.
At the same time, this vision is always selective. Data does not capture reality in its entirety. It captures what systems have been designed to record. The result is not a complete picture of society, but a particular representation shaped by administrative, technical, and institutional priorities.
The Architecture of Visibility
What institutions see depends heavily on the architecture of their information systems. A problem that appears clearly on a dashboard is more likely to attract attention than one that exists only in qualitative reports. A condition monitored every day may seem more urgent than one measured once a year. A variable that can be compared across regions may gain greater institutional importance than a phenomenon that resists standardization.
Visibility is therefore not distributed equally.
Some issues become highly legible because they generate continuous data. Others remain difficult to observe because they depend on context, interpretation, or forms of knowledge that are not easily transformed into metrics.
This creates a hierarchy of visibility within institutions.
Operational performance may be tracked precisely, while organizational culture remains vague. Response times may be measured continuously, while user trust is assessed only occasionally. Financial activity may be monitored in detail, while informal exclusion remains difficult to detect.
The architecture of data systems therefore influences institutional attention. It helps determine which problems are repeatedly seen, which ones are considered urgent, and which ones remain at the margins of decision-making.
Institutional vision is shaped not only by what exists, but by what becomes visible enough to count.
The Power of Legibility
James C. Scott has described how states historically simplified complex social realities in order to make them administratively legible. Standardized names, cadastral maps, censuses, and classifications allowed governments to govern populations at scale, but these processes also reduced local complexity into forms that could be understood from the center.
Digital systems extend this logic of legibility.
Individuals become data profiles. Communities become statistical units. Economic behavior becomes transaction records. Social conditions become indexes. Complex realities are translated into structures that can be analyzed and compared.
Legibility creates administrative power because what can be seen can be acted upon.
A region identified as underperforming can receive intervention. A population classified as vulnerable can become the target of assistance. A transaction categorized as suspicious can be reviewed. A service unit with declining performance can attract management attention.
Yet legibility is not the same as understanding. A system may successfully identify a pattern without explaining the causes behind it. A category may help institutions organize populations while concealing important differences among the people placed within it.
The danger appears when administrative visibility is treated as equivalent to social reality.
Data and the Construction of Institutional Reality
Data does not simply enter institutions and wait to be interpreted. It becomes part of the way institutions construct reality.
Once a condition is translated into an indicator, it can enter meetings, reports, evaluations, and strategic discussions. Once a category becomes standardized, future records are organized according to it. Once a ranking is established, institutions begin comparing themselves through its terms.
Over time, the representation gains institutional authority.
A problem with a measurable indicator can become easier to recognize than one without a metric. A group that appears clearly within administrative data can become more visible than a population that remains poorly recorded. A performance target can shape organizational behavior because people understand that the target will be monitored.
Data therefore creates feedback loops between observation and action.
Institutions measure reality, then act upon what they have measured. Those actions change behavior, which produces new data. The new data then appears to confirm or challenge the original representation.
Institutional vision is therefore not passive.
It participates in shaping the world it observes.
The Blindness Created by Measurement
Every system of vision creates blind spots.
This is not a failure unique to data-driven institutions. No institution can observe everything.
The problem emerges when the blind spots created by data systems become difficult to recognize.
A dashboard can create the impression of comprehensive visibility because information appears clean, current, and organized. Indicators seem to provide a complete overview of performance. Yet the system displays only what has been captured, classified, and processed.
Problems outside the measurement system remain invisible.
A citizen who does not file a complaint does not appear in complaint statistics. Informal work may remain outside economic records. Institutional fear may not appear in employee surveys. A community disconnected from digital services may generate fewer administrative traces.
The absence of data can therefore be misinterpreted as the absence of a problem.
This is one of the most important limits of institutional vision.
Institutions can become highly informed about what their systems capture while remaining uncertain about what those systems fail to record.
The Importance of Missing Data
Missing data is often treated as a technical problem.
Sometimes it is.
Records may be incomplete, databases may contain errors, and reporting systems may fail to collect information consistently.
But missing data can also have social meaning.
A population may be underrepresented because access to administrative services is weak. A problem may be underreported because people fear consequences. Certain experiences may remain outside datasets because institutions never created categories to capture them.
Absence therefore deserves interpretation.
An institution should not only ask whether data is complete. It should also ask why certain information is missing.
Who is difficult to see?
Which activities remain outside formal systems?
What kinds of experiences do existing categories fail to capture?
These questions expand institutional vision beyond data quality.
They transform missing information into an object of inquiry.
A mature data system does not simply attempt to fill every gap. It tries to understand what the gaps reveal about the limits of institutional knowledge.
Seeing Society Through Categories
Institutional vision depends heavily on classification because large organizations cannot interpret reality without categories.
People are grouped by age, income, location, occupation, educational level, risk profile, or administrative status. Services are divided into types. Cases are classified according to urgency. Regions are grouped by performance.
Classification enables order.
It also simplifies.
People who share the same category may have very different circumstances. Communities that appear similar statistically may differ significantly in history, culture, or infrastructure. A standard category can create administrative clarity while reducing contextual understanding.
Bowker and Star have shown how classification systems shape the realities they organize. Categories become embedded in institutions, databases, forms, and routines until they appear natural.
This matters because categories shape future visibility.
If a phenomenon does not fit the available classifications, it may remain difficult to record.
If a category becomes dominant, future information may continue to reproduce the same framework.
Institutional vision can therefore become path-dependent.
The way institutions learn to see today influences what they will be capable of seeing tomorrow.
Dashboards and the View From Above
The dashboard has become one of the most recognizable instruments of institutional vision.
It provides a view from above.
Complex operations are summarized through charts, indicators, maps, and alerts. Decision-makers can compare units, identify trends, and detect anomalies quickly.
This creates enormous administrative value.
But the view from above is necessarily different from the view from within.
A dashboard may show that service performance is improving while frontline employees experience increasing complexity. It may show that a region meets targets while local conditions remain uneven. It may show stable risk levels while emerging concerns remain outside the indicators.
The dashboard produces distance.
Distance can improve perspective because it allows patterns to become visible.
Distance can also remove context.
Institutional vision therefore needs movement between scales.
Leaders need aggregated data.
They also need mechanisms for understanding local experience.
The strongest institutional vision is not purely top-down or bottom-up.
It combines both.
Prediction and Anticipatory Vision
Datafied institutions increasingly seek not only to understand the present, but to anticipate the future.
Predictive analytics can identify potential risk, forecast demand, estimate future service needs, and detect patterns that suggest emerging problems.
This creates anticipatory institutional vision.
Instead of waiting for events to occur, organizations can act earlier.
The benefits can be substantial.
Resources can be allocated proactively.
Risks can be reduced.
Policies can be adjusted before problems become crises.
But prediction introduces new limitations.
Predictive systems rely on historical data.
They assume that patterns from the past contain useful information about the future.
Often they do.
Yet societies change.
Institutions change.
Behavior changes.
Historical patterns may not remain stable.
More importantly, predictions can influence the behavior they attempt to forecast.
A neighborhood classified as high risk may receive more monitoring.
A group identified as vulnerable may receive more intervention.
A person predicted to be risky may experience different treatment.
The act of prediction therefore becomes part of the environment that shapes future outcomes.
Institutional vision moves from observation into intervention.
The Distance Between Data and Experience
Data allows institutions to operate at scales that direct experience cannot support.
But the greater the scale, the greater the risk of distance between decision-makers and the people represented by the data.
A percentage can summarize thousands of experiences.
It cannot reproduce them.
An index can compare regions.
It cannot communicate every local condition.
A score can identify a pattern.
It cannot fully explain the circumstances of the individual receiving it.
This distance does not make data unreliable.
It defines the limits of what data can provide.
Institutional knowledge therefore requires multiple forms of evidence.
Quantitative analysis reveals patterns.
Qualitative evidence explains meaning.
Field observation reveals context.
Professional experience identifies exceptions.
Public participation can reveal realities that administrative data has not captured.
Institutional vision becomes stronger when these forms of knowledge are connected rather than treated as competitors.
Data Rich, Context Poor
One of the paradoxes of the datafied world is that institutions can become increasingly data rich while remaining context poor.
They may know more about transactions, movements, performance, and behavior than ever before.
Yet greater information does not automatically produce greater understanding.
A system may detect that something is happening without explaining why.
A correlation may reveal a relationship without establishing its meaning.
A trend may appear clearly while the conditions producing it remain uncertain.
This distinction is essential because modern institutions can become increasingly confident as their datasets grow.
The accumulation of information can create a sense that uncertainty is disappearing.
In reality, some forms of uncertainty cannot be solved through additional data alone.
They require interpretation.
They require knowledge of history.
They require understanding of social conditions.
They may require conversations with people whose experiences cannot be reduced to records.
Institutional intelligence therefore depends not only on the volume of data available, but on the quality of interpretation surrounding it.
Institutional Vision and Power
The ability to see is never distributed equally.
Large institutions may possess extensive information about citizens, customers, employees, or users, while those individuals know far less about how institutions interpret them.
This creates an asymmetry of visibility.
Institutions can classify populations without individuals knowing which categories were used.
Platforms can observe behavior while users have limited understanding of how the resulting data shapes recommendations.
Organizations can measure performance while employees may not know how different indicators are weighted.
Visibility therefore becomes a form of power.
Those who possess the capacity to observe, classify, compare, and predict gain the ability to act upon those who are observed.
This does not make institutional data use inherently oppressive.
Knowledge is essential to governance.
But the asymmetry deserves attention.
Data governance should therefore concern not only privacy and security, but also the distribution of interpretive power.
Who sees whom?
Who defines the categories?
Who determines what the data means?
Who can challenge the interpretation?
Institutional vision becomes legitimate when the people being seen are not entirely excluded from the process through which they are understood.
The Problem of Overconfidence
Better data can improve decision-making.
But better data can also create greater confidence.
Confidence becomes dangerous when institutions forget the limits of their own information systems.
A sophisticated model may still depend on weak assumptions.
A comprehensive dashboard may still omit important variables.
A large dataset may still contain systematic gaps.
A highly accurate prediction may still be inappropriate for an unusual case.
Institutional humility is therefore an important form of data literacy.
Organizations need the ability to say not only what they know, but what they do not know.
This is especially important in environments where data is presented with technical precision.
Decimal points can create an impression of certainty.
Complex models can appear authoritative.
Artificial intelligence can produce explanations that sound complete.
Yet precision in presentation does not guarantee completeness in understanding.
A strong institution does not interpret uncertainty as weakness.
It treats uncertainty as information.
Human Judgment Within Institutional Vision
The expansion of data does not eliminate the need for human judgment.
It changes its role.
Where decision-makers once spent substantial time gathering information, they may increasingly spend their time evaluating the information produced by systems.
Judgment becomes the ability to connect data with context.
It requires recognizing when an indicator is meaningful, when a pattern is misleading, when a prediction should be questioned, and when an exceptional case deserves different treatment.
This is not a rejection of data-driven governance.
It is a more demanding version of it.
Data should challenge human assumptions.
Human judgment should challenge inappropriate interpretations of data.
The relationship needs to be reciprocal.
Institutions become vulnerable when one side is allowed to dominate completely.
Pure intuition can ignore evidence.
Pure quantification can ignore meaning.
Institutional vision becomes strongest when evidence and interpretation remain connected.
Seeing Beyond the Measurable
Some dimensions of social and institutional life resist easy measurement.
Trust is difficult to quantify fully.
Dignity is difficult to express as a score.
Fear may remain invisible in formal reporting.
Professional judgment may not appear clearly in performance indicators.
Institutional legitimacy cannot be captured entirely through satisfaction surveys.
This does not mean that such concepts cannot be studied or measured at all.
It means that measurement captures only selected dimensions.
Institutions need to preserve awareness of realities that cannot be fully represented through their information systems.
This requires spaces for narrative, reflection, field observation, and professional interpretation.
A society that values evidence should not become suspicious of everything that cannot be expressed numerically.
Some forms of knowledge are contextual rather than statistical.
Institutional vision needs both.
From Data-Driven to Data-Informed Institutions
The language of data-driven decision-making suggests that data should provide direction.
A more useful idea may be the data-informed institution.
A data-informed institution uses evidence seriously but does not treat evidence as self-interpreting.
It understands that indicators require context.
It recognizes that categories can be contested.
It examines missing data.
It allows professional judgment to challenge automated outputs.
It combines aggregated information with local knowledge.
This distinction matters because institutions should not be driven by whatever information happens to be easiest to measure.
Their decisions should be guided by purpose.
Data serves that purpose by expanding what institutions can know.
It should not determine the purpose itself.
A data-informed institution therefore asks not only what the numbers show, but whether the numbers represent the reality relevant to the decision.
Institutional Vision in the Age of AI
Artificial intelligence will significantly expand institutional vision.
AI systems can summarize enormous collections of documents, identify patterns across datasets, detect anomalies, generate predictions, and integrate information that would previously have required large teams of analysts.
This may allow institutions to understand themselves and the societies they serve in ways that were previously impossible.
But AI also intensifies the problems already associated with datafication.
The systems may produce interpretations that appear coherent without revealing the assumptions behind them.
They may combine information across domains in ways that are difficult to inspect.
Their recommendations may become influential before institutions fully understand their limitations.
The future challenge will therefore not be simply developing more intelligent systems.
It will be developing institutions capable of using them intelligently.
This requires technical capacity, but it also requires institutional judgment, ethical awareness, transparency, and the ability to maintain alternative sources of knowledge.
AI may expand the field of institutional vision.
It should not narrow the definition of what counts as knowledge.
Learning to See the Limits of Seeing
The datafied world offers institutions unprecedented capacity to observe, compare, predict, and act.
This capacity can improve governance, reveal inequality, strengthen accountability, and support more responsive decision-making.
But every form of vision has limits.
Data makes some realities visible by translating them into forms that institutions can process.
Other realities become harder to see because they resist standardization, remain outside administrative systems, or depend on context that does not survive aggregation.
Institutional maturity therefore requires more than better information systems.
It requires awareness of the boundaries of those systems.
The most capable institution is not the one that believes it can see everything.
It is the one that understands where its vision becomes incomplete and knows how to look beyond it.
In a datafied world, institutional intelligence will depend not only on the ability to collect more information, but on the capacity to recognize the difference between visibility and understanding.
References
Bowker, G. C., & Star, S. L. (1999). Sorting Things Out: Classification and Its Consequences. MIT Press.
Espeland, W. N., & Stevens, M. L. (1998). Commensuration as a social process. Annual Review of Sociology, 24, 313–343.
Merry, S. E. (2016). The Seductions of Quantification: Measuring Human Rights, Gender Violence, and Sex Trafficking. University of Chicago Press.
Porter, T. M. (1995). Trust in Numbers: The Pursuit of Objectivity in Science and Public Life. Princeton University Press.
Scott, J. C. (1998). Seeing Like a State: How Certain Schemes to Improve the Human Condition Have Failed. Yale University Press.

